Explore colocalized annotations
Setup
[1]:
%matplotlib inline
%load_ext autoreload
%autoreload 2
[41]:
import matplotlib.pyplot as plt

from metaspace import SMInstance
[75]:
sm = SMInstance(host='https://metaspace2020.eu')
[76]:
ds = sm.dataset(id='2016-09-22_11h16m41s')
ds
[76]:
SMDataset(Brain01_Bregma1-42_03b_centroid | ID: 2016-09-22_11h16m41s)
Explore
[77]:
def fetch_images(ds, annotations):
    ann_images = {}
    for formula, adduct in annotations:
        image = ds.isotope_images(formula, adduct, only_first_isotope=True)[0]
        ann_images[(formula, adduct)] = image
    return ann_images
[78]:
database = 'HMDB-v4'
fdr = 0.1
[97]:
formula, adduct = 'C44H86NO8P', '+K'
coloc_with = f'{formula}{adduct}+'
coloc_with
[97]:
'C44H86NO8P+K+'
[98]:
df = ds.results(database=database, fdr=fdr, coloc_with=coloc_with)
df.shape
[98]:
(70, 10)
[99]:
df.head()
[99]:
| msm | moc | rhoSpatial | rhoSpectral | fdr | mz | moleculeNames | moleculeIds | intensity | colocCoeff | ||
|---|---|---|---|---|---|---|---|---|---|---|---|
| formula | adduct | ||||||||||
| C44H86NO8P | +K | 0.968373 | 0.998973 | 0.974551 | 0.994682 | 0.05 | 826.572242 | [PC(14:0/22:1(13Z)), PC(14:1(9Z)/22:0), PC(16:... | [HMDB0007887, HMDB0007919, HMDB0007978, HMDB00... | 102675520.0 | 1.000000 |
| C41H77O8P | +K | 0.891320 | 0.998937 | 0.919016 | 0.970895 | 0.05 | 767.498742 | [PA(14:1(9Z)/24:1(15Z)), PA(16:0/22:2(13Z,16Z)... | [HMDB0114811, HMDB0114845, HMDB0114865, HMDB01... | 31453472.0 | 0.990299 |
| C44H84NO8P | +K | 0.673025 | 0.998565 | 0.706544 | 0.953929 | 0.10 | 824.556592 | [PC(18:1(9Z)/18:1(9Z)), PC(14:0/22:2(13Z,16Z))... | [HMDB0000593, HMDB0007888, HMDB0007920, HMDB00... | 22027492.0 | 0.988065 |
| C41H77O8P | +Na | 0.637693 | 0.998815 | 0.670961 | 0.951543 | 0.10 | 751.524805 | [PA(14:1(9Z)/24:1(15Z)), PA(16:0/22:2(13Z,16Z)... | [HMDB0114811, HMDB0114845, HMDB0114865, HMDB01... | 8825182.0 | 0.987032 |
| C46H84NO8P | +H | 0.882796 | 0.998592 | 0.902701 | 0.979329 | 0.05 | 810.600710 | [PC(16:0/22:4(7Z,10Z,13Z,16Z)), PC(18:0/20:4(5... | [HMDB0007988, HMDB0008048, HMDB0008049, HMDB00... | 26965624.0 | 0.980838 |
[100]:
top_n = 10
top_coloc_anns = df.head(top_n).index.tolist()
len(top_coloc_anns)
[100]:
10
[101]:
most_coloc_images = fetch_images(ds, top_coloc_anns)
len(most_coloc_images)
[101]:
10
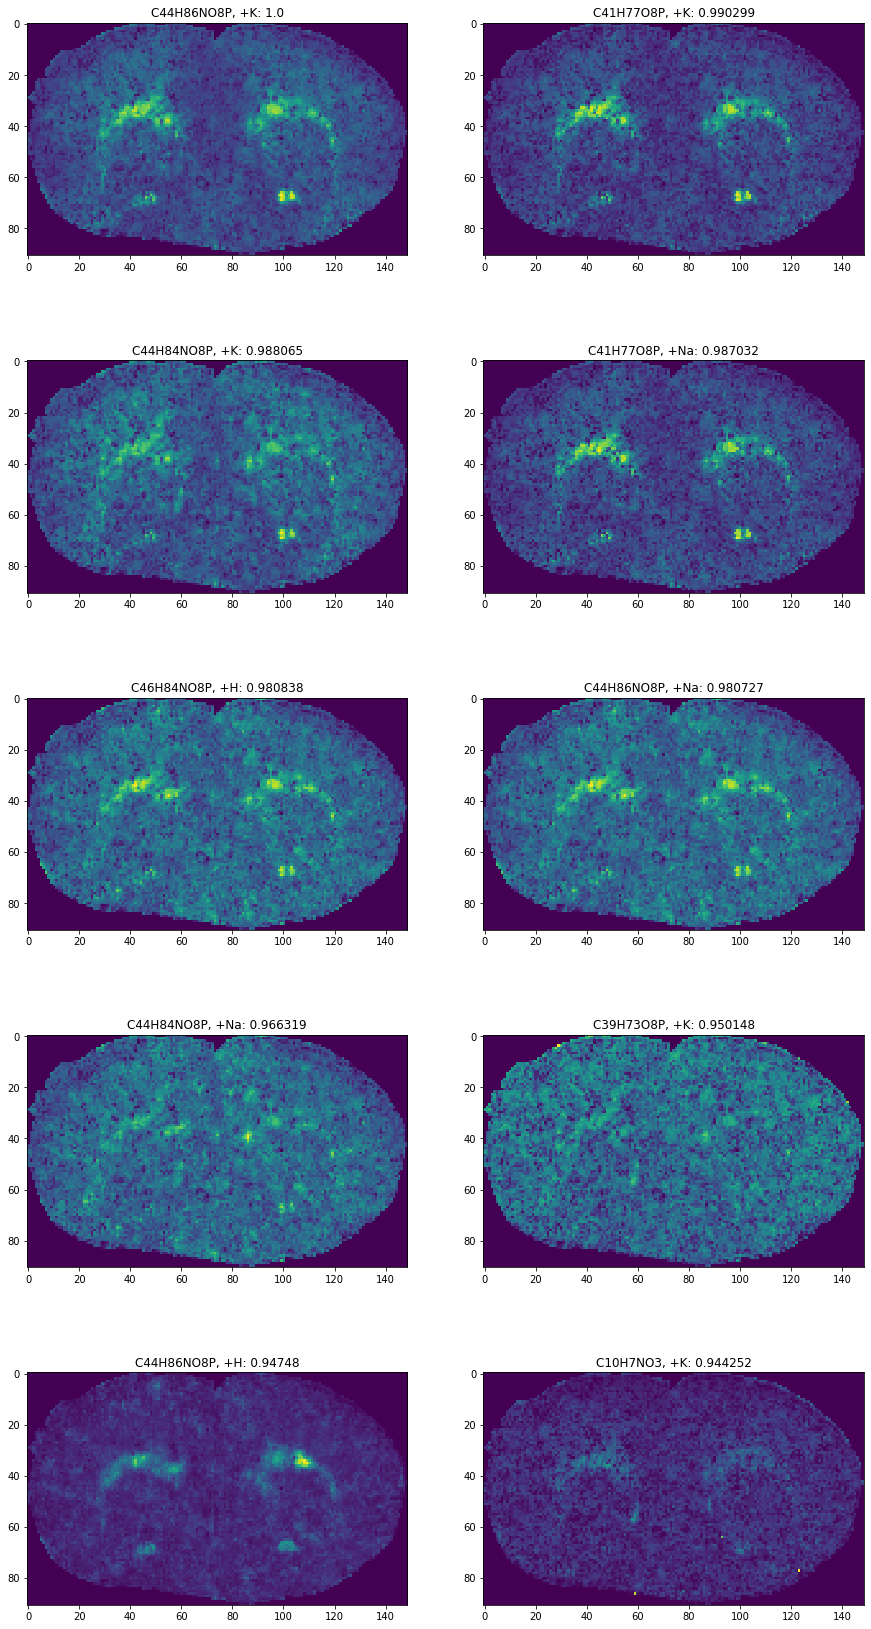
[102]:
fig, axes = plt.subplots(5, 2, figsize=(15, 30))
axes = axes.flatten()
for i, row in enumerate(df.head(top_n).itertuples()):
    formula, adduct = row.Index
    image = most_coloc_images[(formula, adduct)]
    axes[i].imshow(image)
    axes[i].set_title(f'{formula}, {adduct}: {row.colocCoeff}')
[ ]: